Use the Reports feature to produce lists, summaries and charts from the data in your HotH system.
The Reports summary is accessed from the Reports icon in the left hand side menu:
![]()
Click the links below to learn more information:
- Running and Creating a New Report
- Scheduling Reports
- Creating Alert Reports
- Reporting on Customer Feedback Results
- Creating Report Dashboards
- The KPI Monitor
Running and Creating a New Report
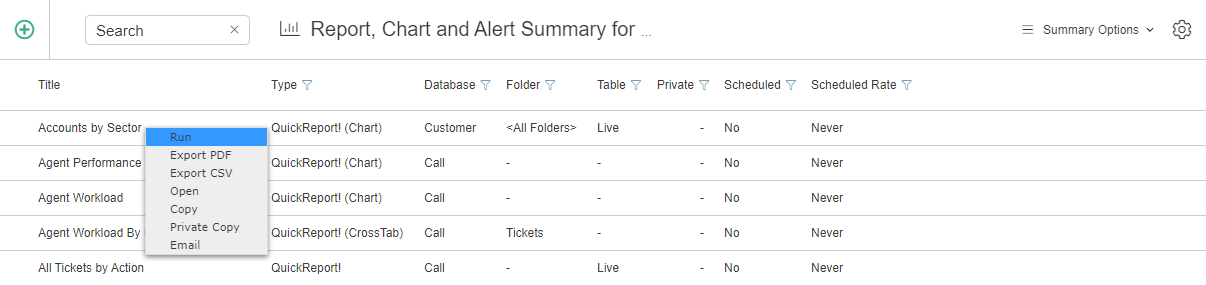
Right click on a report to present a list of options:
- Run – Run the selected report
- Export PDF – Creates a PDF version of the highlighted report
- Export CSV – Creates a text files containing comma separated values. You can browse the results
- Copy – Creates a report based on a selected report. The new report is added to the list and is initially titled ‘Copy # of <original title>’. You should therefore open the report to change the title and other details
- Private Copy – Creates a Private copy of the selected report. This will only be visible to the logged-in user that has created the private copy
- Email – Email selected report to a contact
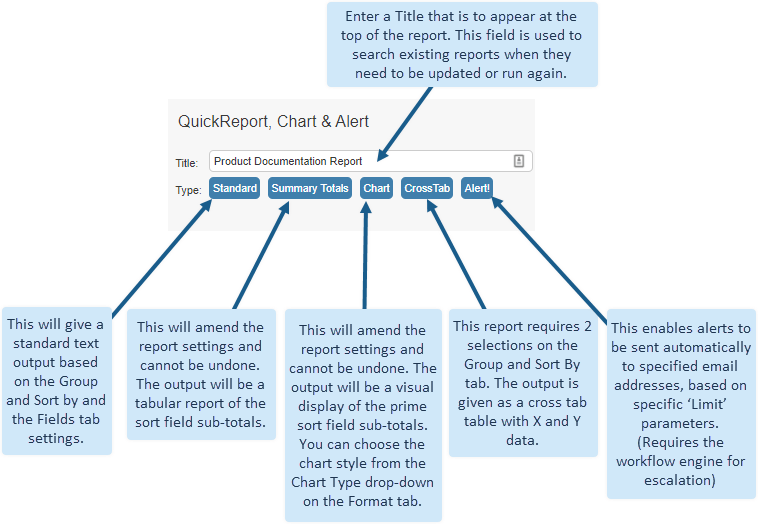
Click the Add![]() button to create a new report.
button to create a new report.
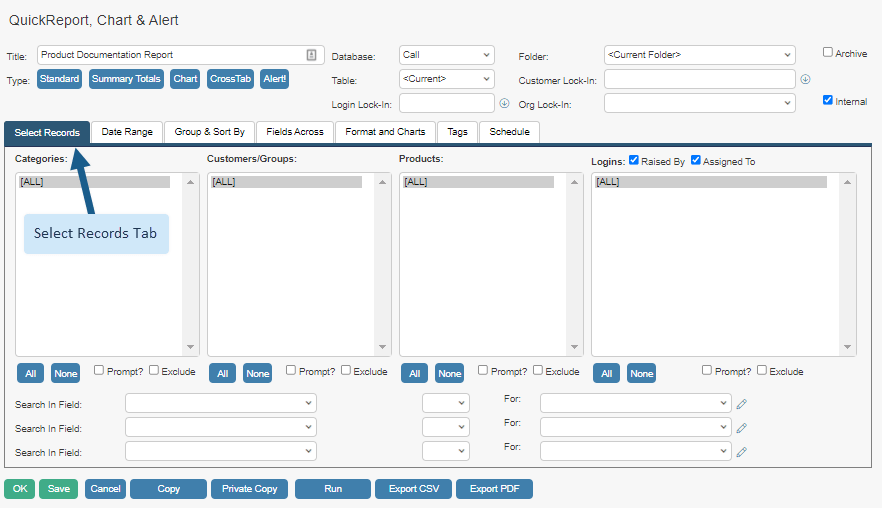
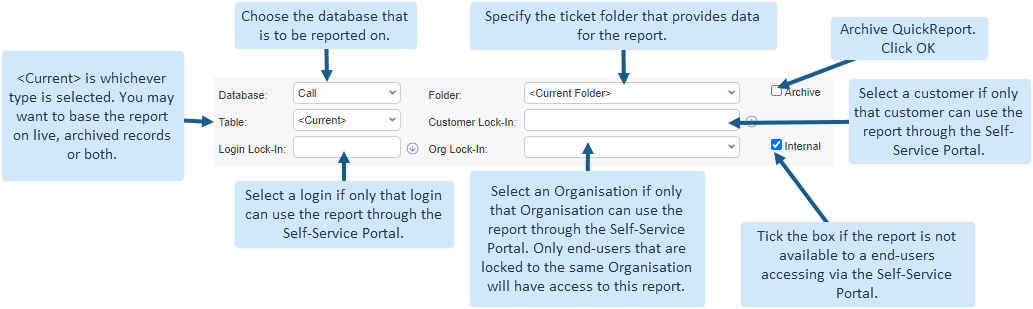
Reports are designed over various tabs:
![]()
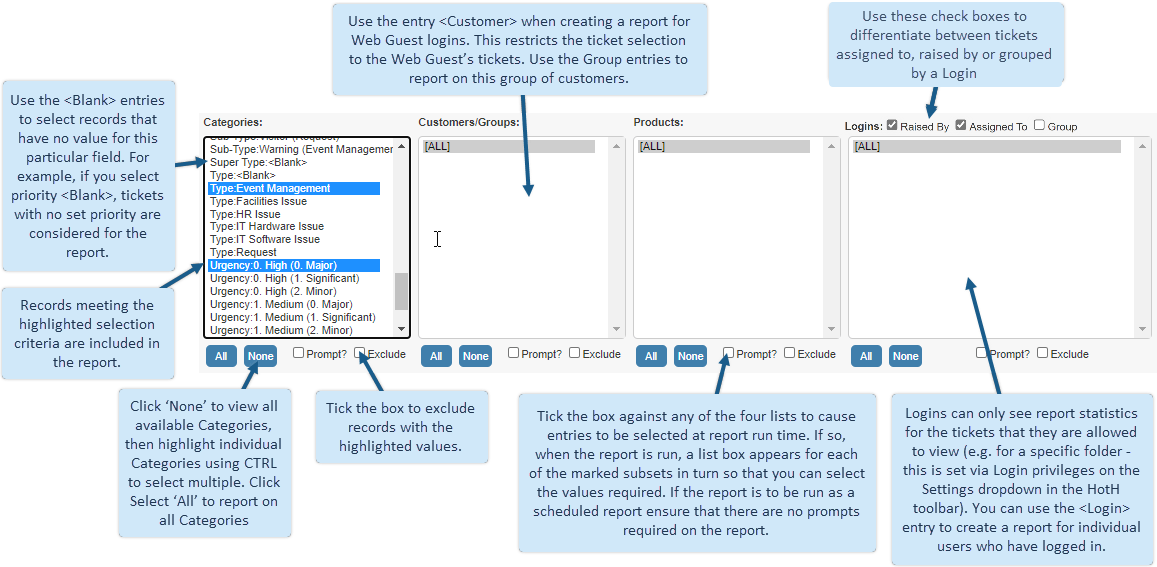
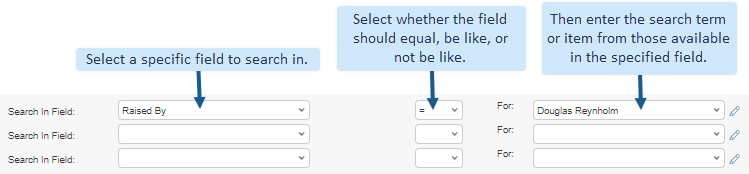
Select Records Tab
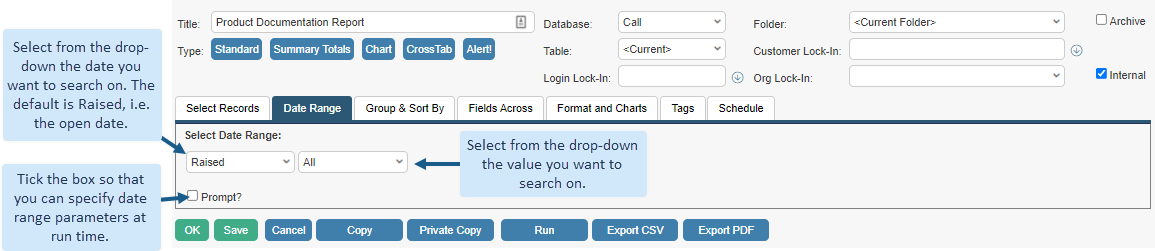
Date Range Tab
| Value Selector |
|
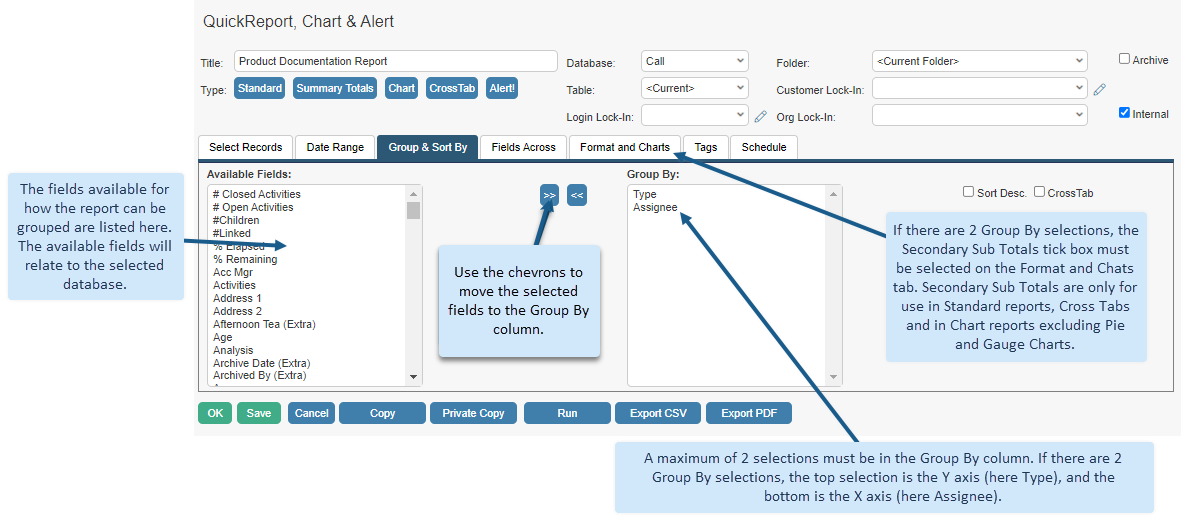
Group and Sort By Tab
Fields Across Tab
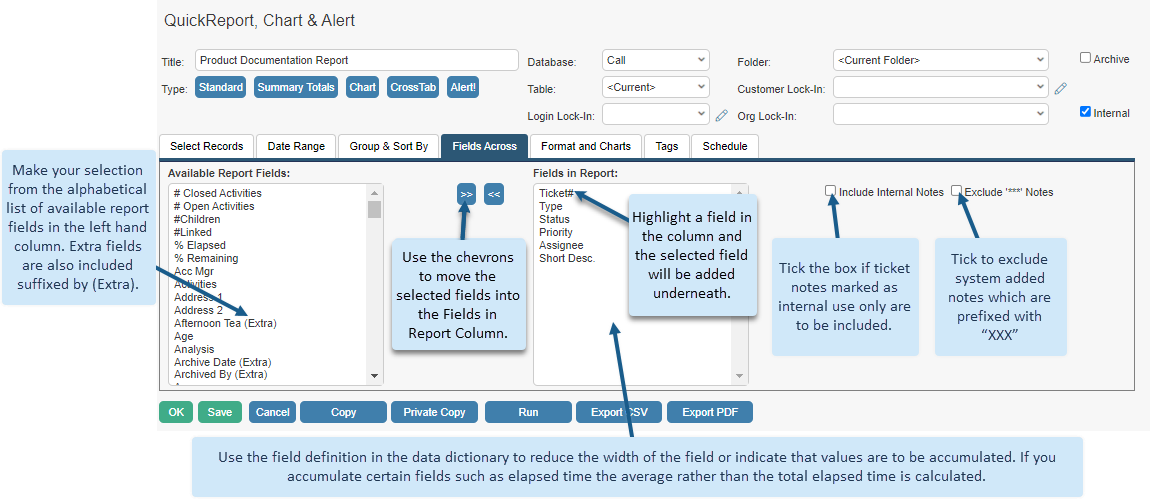
Fields are for use in all but Summary and Chart Only reports. If ‘Drill Down’ is included on a Chart report, then field selections will be required.
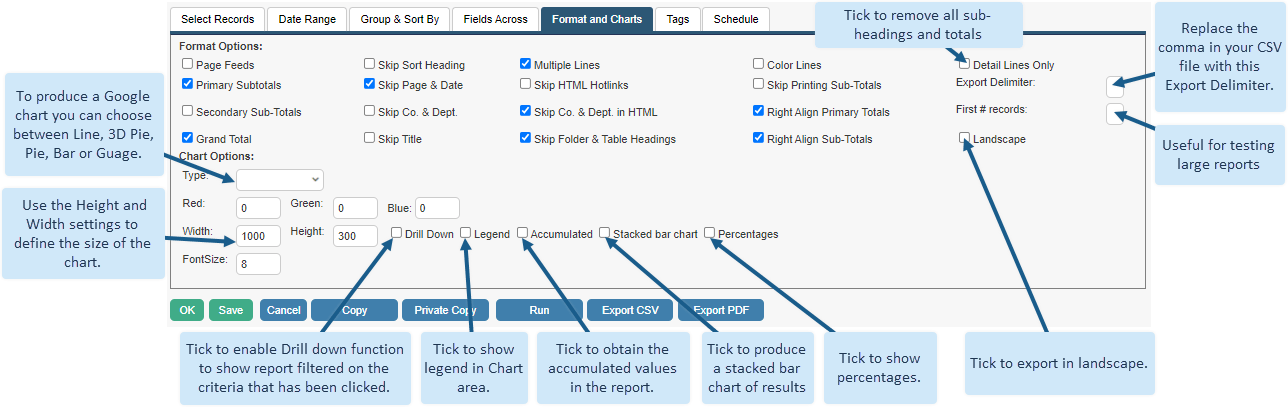
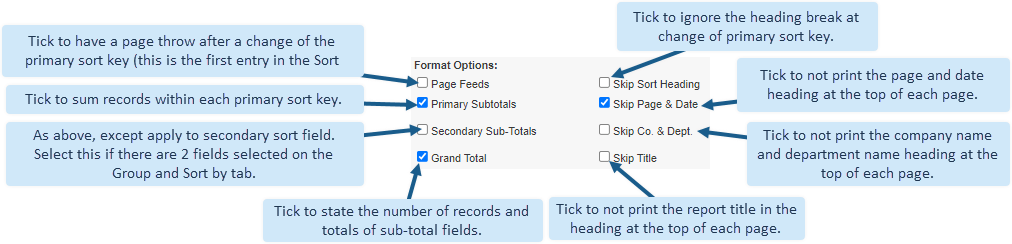
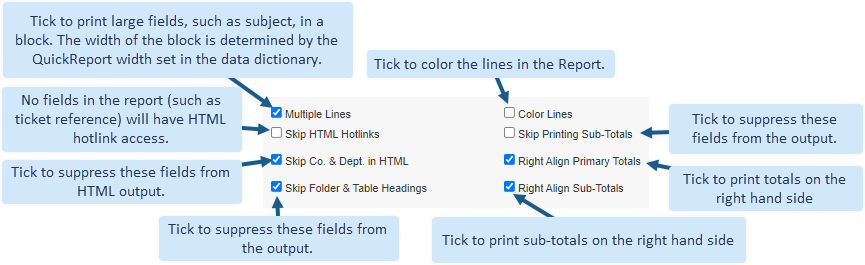
Format and Charts Tab
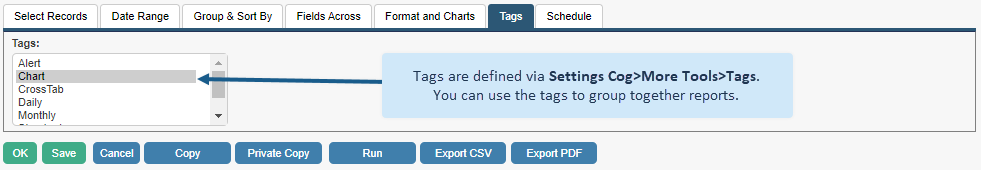
Tags Tab
Tags help to sort Reports together when searching.
Schedule Tab
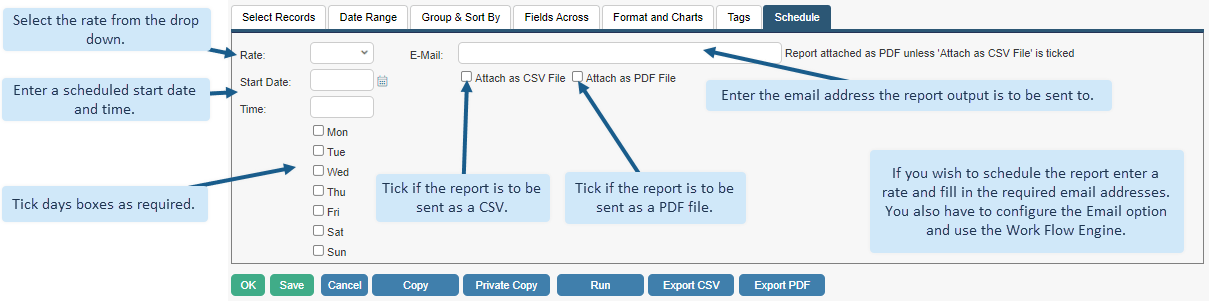
NOTE. If a report is to be scheduled, please ensure that that none of the tabs have the “Prompt” option set as this will prevent the report from running.
Creating Alert Reports
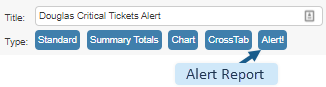
House-on-the-Hill includes the option to select the Type of report from the first screen of the QuickReport Designer. From here, select the Report Type – Alert!
Alert Report Designer
- Set a numerical Alert Limit & Check Rate
- Input a relevant Email address
- Highlight a Category, Customer or Product
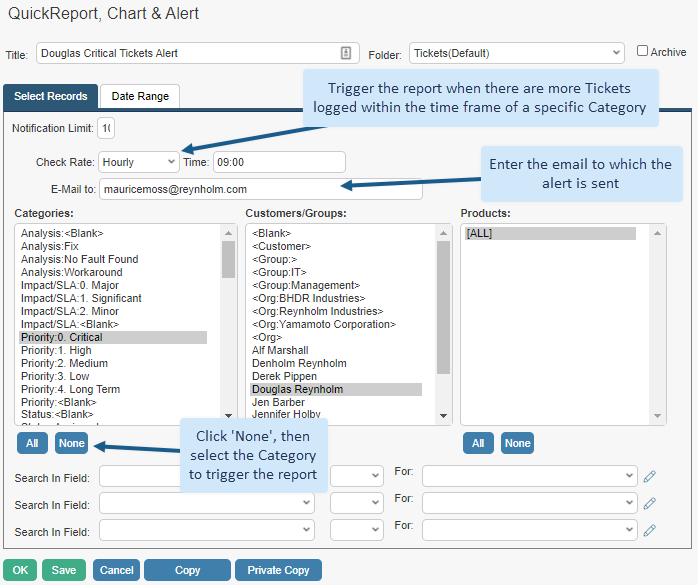
In this example, if more than 10 ‘Critical’ priority tickets are logged for Douglas, an email will be sent to the address entered in the E-Mail field
Reporting on Customer Feedback Results
A report can be created in the QuickReport Designer, to show the results of completed Customer Feedback forms.
In the QuickReport Designer, create a new report (![]() ), enter a Title, report against the Ticket/Call Database, and make sure the correct Folder is selected.
), enter a Title, report against the Ticket/Call Database, and make sure the correct Folder is selected.
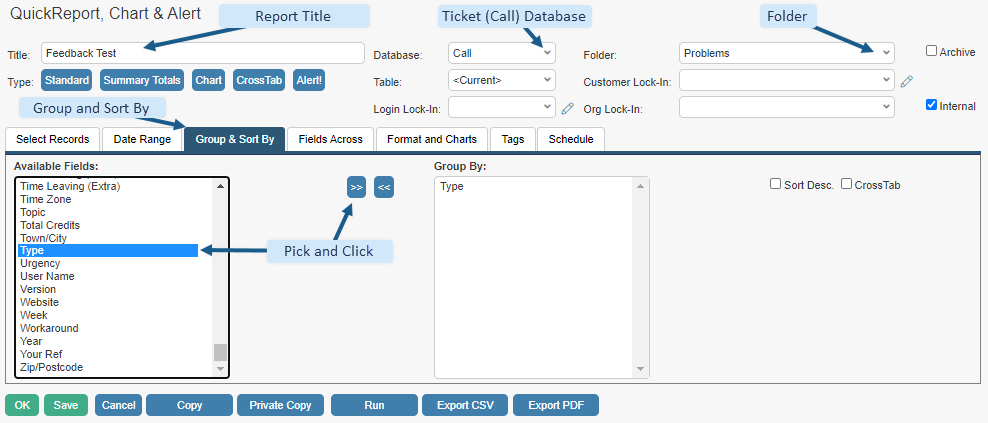
On the Group & Sort By tab, select using the chevrons how you wish to Group the report e.g. by Assignee, by ticket Type, Sub-Type, Closure Code etc.:
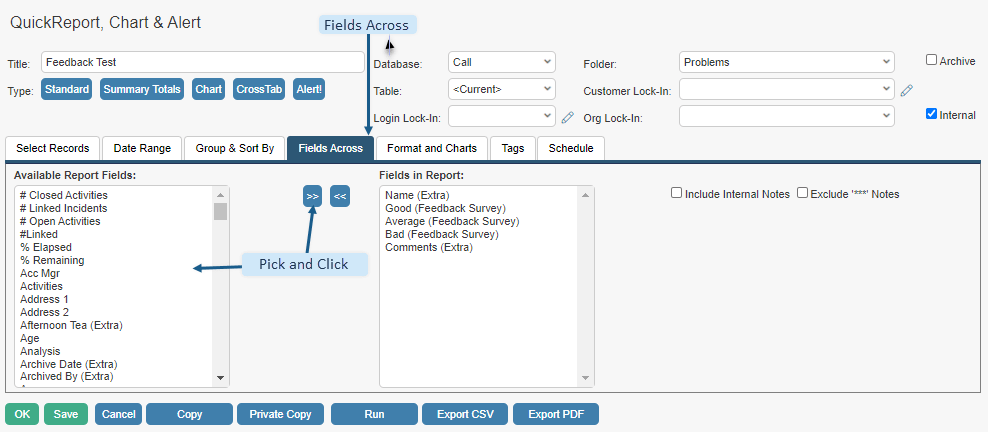
Next, on the Fields tab, use the chevrons to select the Feedback form fields that you wish to report on and click OK to save the report:
Creating Report Dashboards
Once QuickReports have been created, these will appear in the drag and drop Dashboard Designer. This allows Service-Desk Agents and End-Users to have live reports embedded within their dashboards.
When logged in click the Edit Dashboard link from your dashboard:
![]()
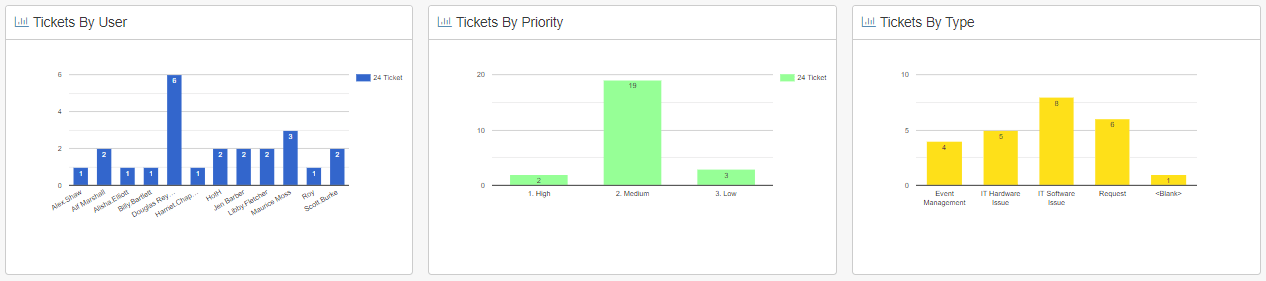
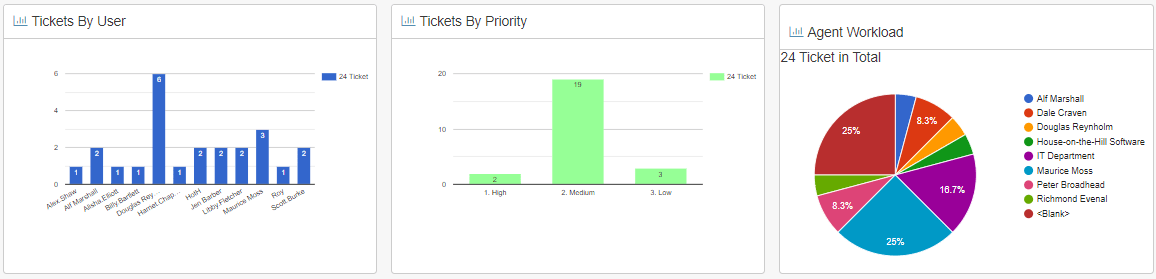
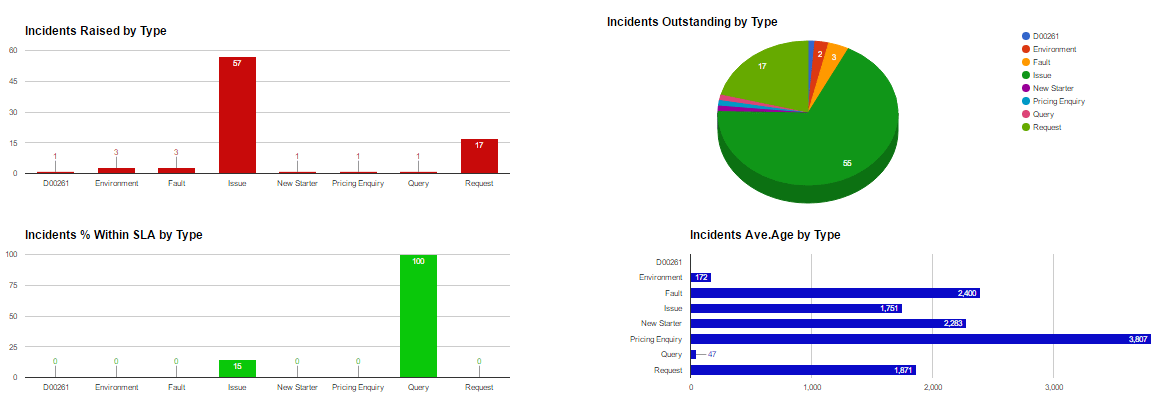
Build custom performance dashboards by dragging existing reports onto the dashboards builder table.
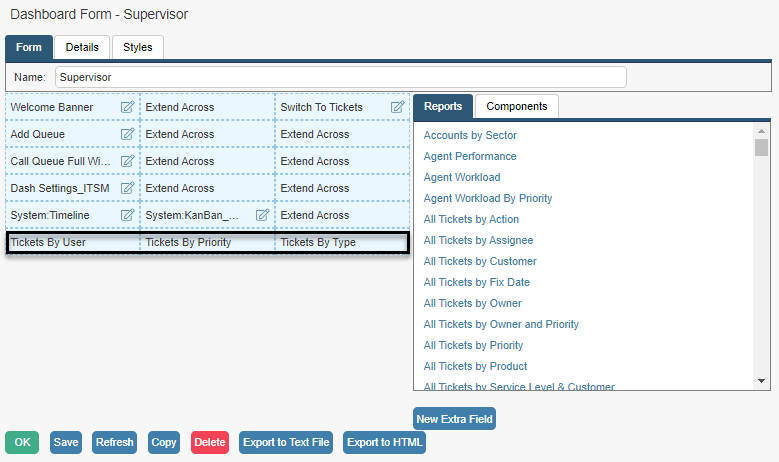
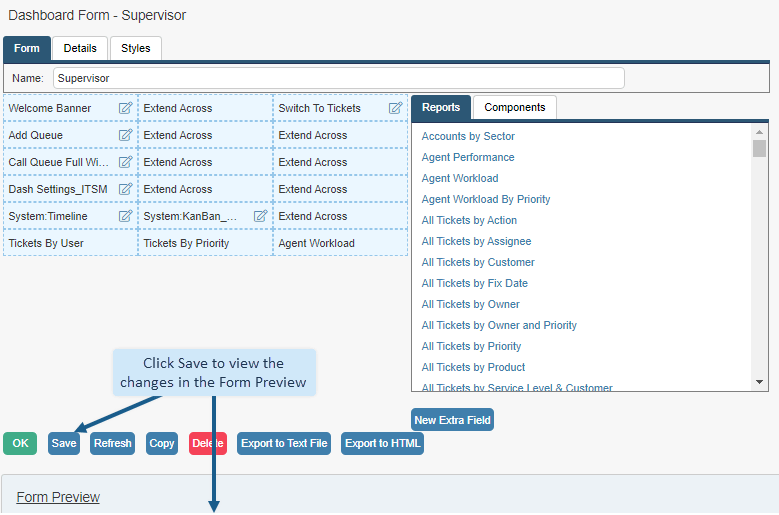
Build performance dashboards by dragging existing reports onto the dashboards builder table.
The dashboard can then be associated with individual logins:
Read the Dashboard Forms Guide for detailed information.
KPI Monitor
KPI: This stands for Key Performance Indicator, and is a measurable and comparable insight into your performance. The KPI Monitor allows you to measure against many different potential KPIs.
SLA: This stands for Service Level Agreement and is traditionally a formal agreement between you and your customers to respond to and/or resolve their tickets within an agreed time period. Your SLAs can be configured within House-on-the-Hill.
Using the KPI Monitor
The KPI Monitor can be launched from the menu and has a unique URL. Click the icon seen below to launch the KPI Monitor:
![]()
The Monitor has the option to Refresh, and Auto Refresh. When first launched, you can decide whether you want the data to automatically refresh or not by selecting or deselecting the Auto tick box.

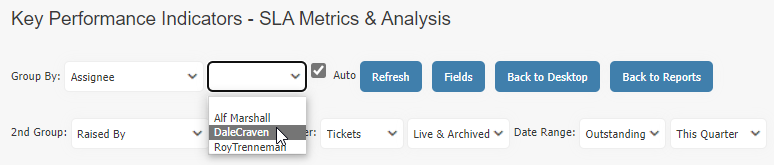
The Monitor can be processed using various drop-downs at the top left of the screen. The first drop-down lists available categories on the ticket screen, such as Assignee, Type, Status, Priority etc. The KPI statistics displayed can be generated just by making a selection from this drop-down.
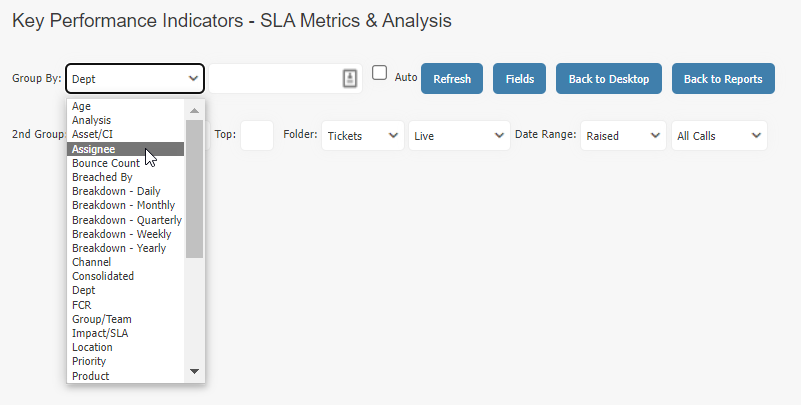
The drop-down to the right of the Group By drop-down will then list the category selections available for whatever is selected in the first drop-down. So, in this example, it will list the Assignee’s.
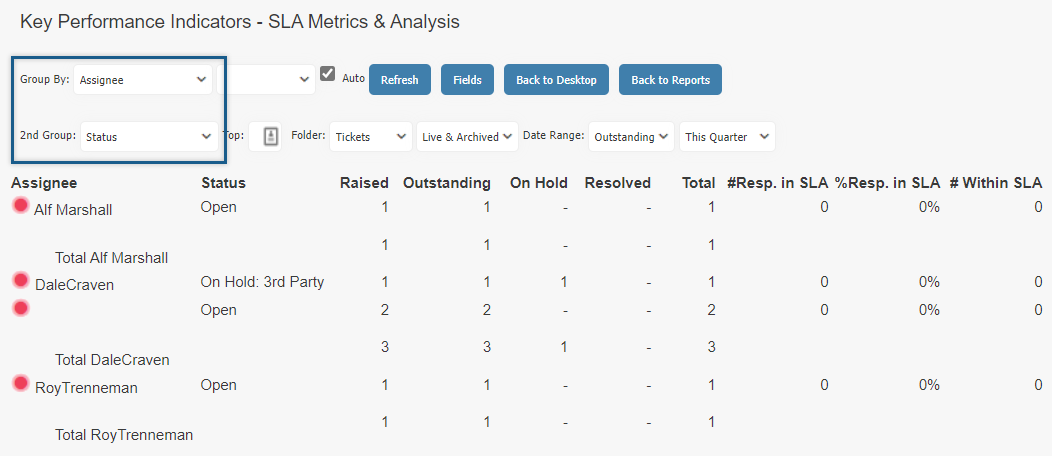
The second drop-down also lists the available categories on the ticket screen. It allows you to select a second level of categorisation, so for example, you could display data for ticket Assignee, and then selecting Status in the second drop-down will then display the Assignees with a breakdown of the status of their tickets.
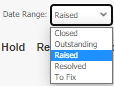
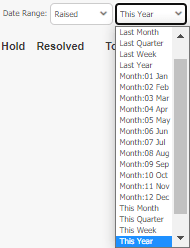
The drop-downs underneath then enable you to select what is displayed based upon ticket milestone, and date range.
You can also choose the Folder you wish the data to be generated for, and the Table.


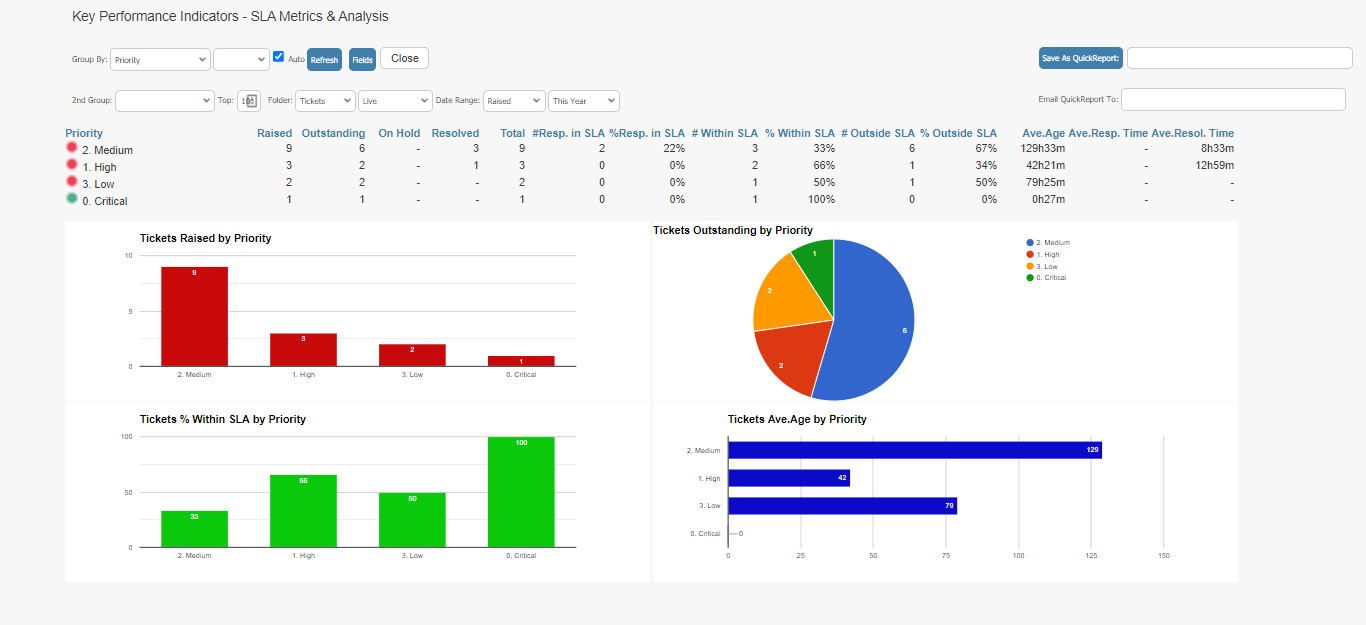
The data displayed will then be generated based upon your selections, and if Auto is ticked, will automatically refresh every minute. The columns list various KPIs, such as total number of tickets for each category, how many are still outstanding, and whether SLA targets have been met.

The KPI Monitor will then generate Reports based upon the selections made. All KPI reports can be incorporated onto Dashboards.
Still haven’t found what you’re looking for? Contact documentation@houseonthehill.com


